
Over the past 25 years since the introduction of the euro, the economic gap between the United States and the eurozone has nearly tripled.
- The economic gap between the United States and the eurozone – in 1999, the year the euro was introduced, the US economy was 11% larger than the eurozone’s economy in terms of purchasing power parity; since then, this difference has increased to 30%
- According to Allianz Trade analysis, even on a per capita basis, the United States leaves Europe far behind: in 2022, the average American enjoyed a real income 35% higher than the average European in terms of purchasing power parity, whereas just before the 2008 financial crisis, this advantage was 27%
- Some of the driving forces behind US dominance are its structural privileges: lower financing costs for the government (relative to growth), lower energy costs, significant advantage in technology, and better demographics
- However, the crux of the problem is that the European Union mainly stumbles over its own shoelaces: excessive regulations and bureaucracy hinder productivity growth, while fragmented capital markets make efficient financing difficult
- One (green) positive – with many facets: the EU takes the initiative in the green transformation – and benefits from it by taking a clear lead in the trade of ecological goods: Germany alone surpasses the USA in ecological exports, and 19 out of 27 EU countries have a clear comparative advantage in this respect
- Also, in terms of some demographic indicators, the United States is in a weaker position compared to Europe (including the striking expected significant decrease in life expectancy in the USA: access to healthcare, drugs, greater income distribution inequality) – and strong social and health indicators are also essential for long-term economic success
- Lessons to be learned (to be completed) – important: the EU spends large amounts on supporting economic development, but its programs are too complicated and fragmented; completing the capital markets union (CMU) started in 2015 – complementing, not replacing, existing banking; also completing the banking union – a stronger financial sector through a deposit guarantee system would increase trust and market integration…
- But… productivity, productivity, and once again productivity – it was (besides the mentioned structural advantages) the key factor distancing the EU from the USA: on average annually from 2008-2023, labor productivity in the USA grew by 0.8 percentage points faster than the productivity of the eurozone
- Poland – launching the RRP under the Next Generation EU initiative: so far, the slow disbursement of these funds across the EU nullifies/delays the potential positive effects of the program worth EUR 750 billion (while in the USA, funds spent to combat the effects of the pandemic have long been working and increasing the value of the American economy) – so far, member states have received only 26% of the funds
US-EU Discrepancies in the Light of US Structural Privileges
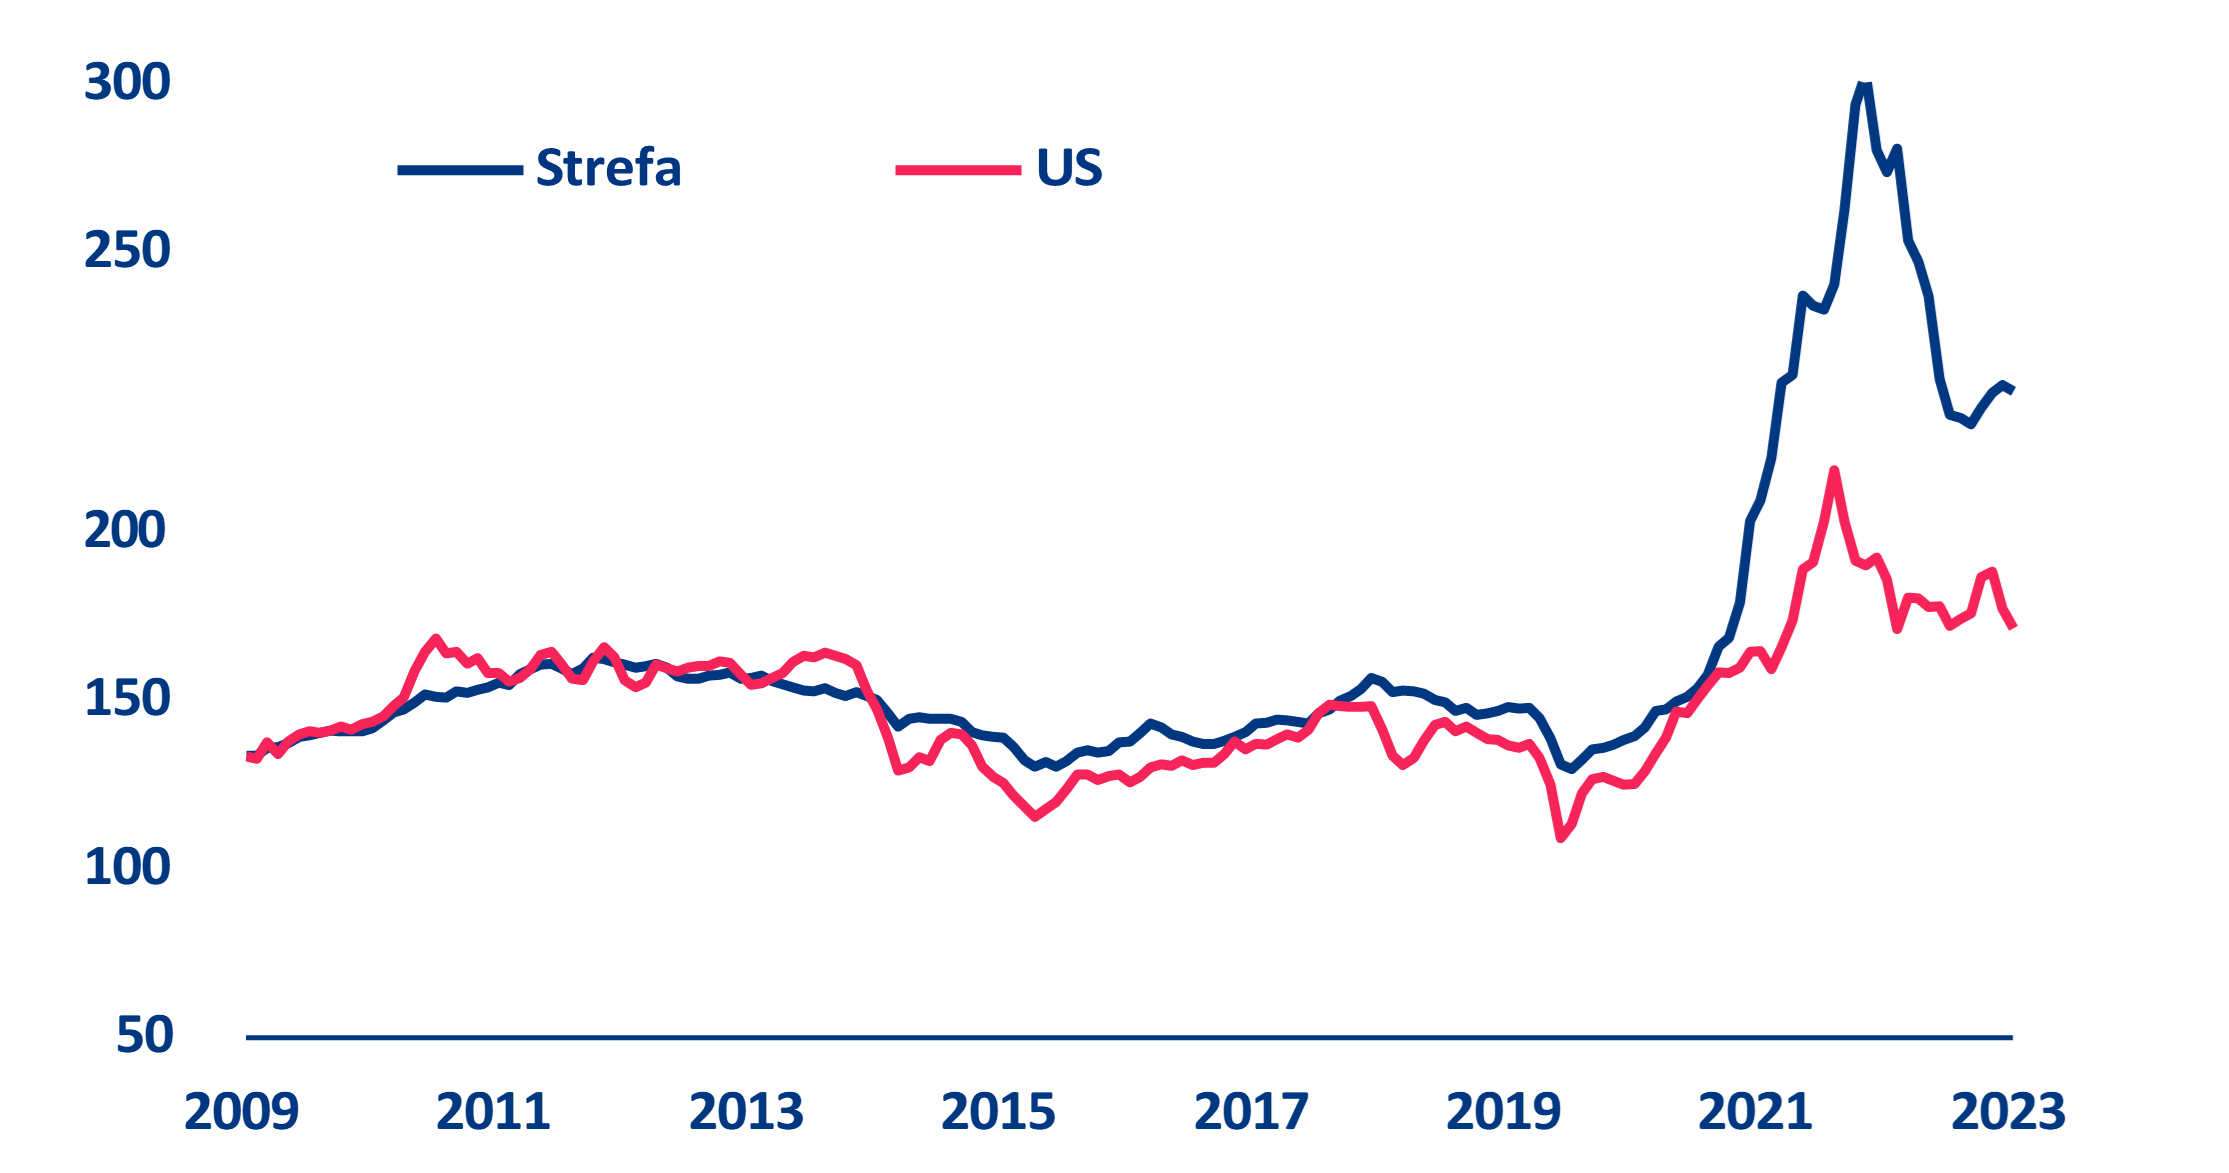
The discrepancy in economic strength, according to Allianz Trade, is also visible through the significant increase in the market value of American companies compared to their European counterparts. In 2007, just before the GFC, the total value or market capitalization of the 500 largest American companies (represented by the S&P 500 stock index) amounted to 14 trillion USD, which was almost equivalent to the value of the S&P 500 index. The total value of the largest 600 European companies was 13 trillion USD (Stoxx Europe 600). However, moving to the present day: the value of companies in the USA has increased almost threefold to 38 trillion USD, while the valuation in Europe has remained almost unchanged. These figures not only reflect past successes but also reflect future expectations for these economic regions, as market capitalization can be interpreted as the discounted expected future cash flows from the companies represented.
GDP in constant international dollars (PPP) and in current US dollars, in trillions
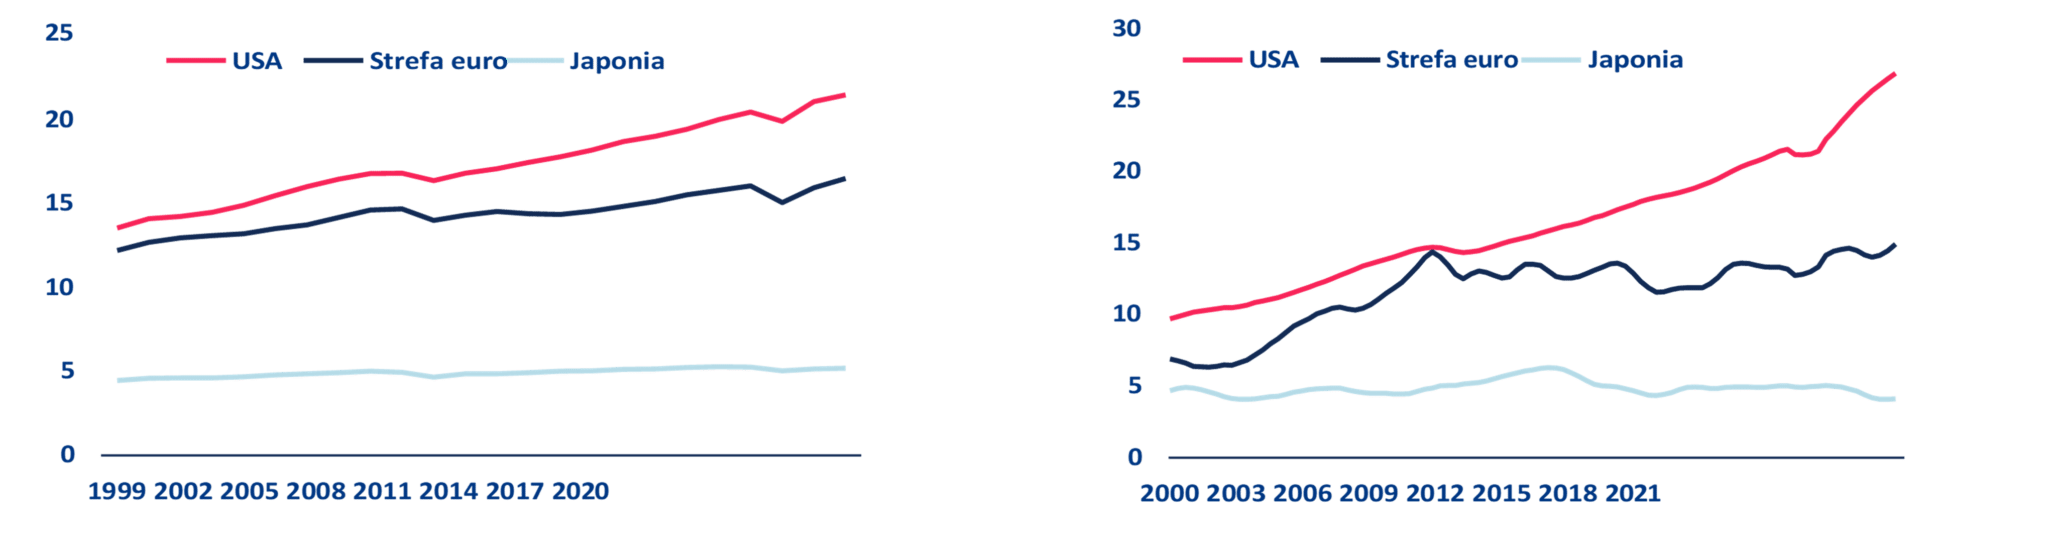 Sources: LSEG Datastream, Allianz Research
Market capitalization of various stock indexes in trillions of USD
 Sources: Bloomberg, Allianz Research
Lower financing costs for the US government (relative to growth): thanks to a large and liquid government debt market, the US government can spend money to exit crises and mitigate their effects (as was the case during the Covid-19 crisis), while eurozone countries have much less fiscal space, considering the risk of state insolvency and redenomination. While the United States can always print its own currency to avoid insolvency. Eurozone countries have tried to pool fiscal strength through initiatives such as the Next Generation EU fund (750 billion EUR) and the RePowerEU plan (225 billion EUR), but slow utilization has minimized positive effects for now, especially compared to the USA, where significantly more IRA funds are already flowing into specific projects.
Secondly, the American economy, according to Allianz Trade, has a significant advantage in terms of energy costs, which has increased even further over the last two years. Energy prices are significantly lower in the USA due to the abundance of natural gas resources. For American companies, electricity bills are 32% lower than their French counterparts (average for 2008-22), 53% lower than Spanish companies, 57% lower than Italian companies, and as much as 63% lower than German companies. In fact, after years of remaining at a fairly stable level, the energy price gap sharply increased by another 30% since 2021 (which could have reduced the EU GDP level by an additional -1 percentage point).
The rising energy costs also resulted in the eurozone’s current account balance turning negative after a decade of surpluses and is likely to remain below pre-pandemic levels. Conversely, the United States has been a net energy exporter since 2019, putting it in a more comfortable situation in the face of various energy uncertainties and geopolitical issues. The United States also benefits from large reserves of industrial raw materials, which are crucial for reindustrialization. While the United States depends on foreign suppliers for some key critical raw materials, it possesses abundant resources of coal, copper, lead, iron, wood, bauxite, and uranium, which are essential for powering the green transformation.
Production prices, energy sector (November 2009 = 100)
Sources: LSEG Datastream, Allianz Research
The United States, in Allianz Trade’s opinion, also benefits from being home to the most dominant technology companies in the world, which enjoy better access to early-stage financing and talents from all over the world. Most of the world’s dominant technology companies are headquartered in the United Kingdom and the United States – in 2022, the state of California alone attracted as much venture capital (into new technologies) as the entire European continent. It’s no wonder that more than three times as many new start-ups are created in the United States as in the largest EU economies.
Moreover, in the eurozone, another obstacle is much smaller domestic markets with different regulations, which limit the key user base at an early stage of development, necessary to gain scale benefits in the technology industry. While Europe is catching up with the USA in adopting digital technologies, delayed digital innovations threaten to create technological dependencies. In terms of market size, the largest American technology companies account for 77% (in a sample of over 500 publicly traded companies), while European ones account for just 6%!
R&D spending as % of GDP
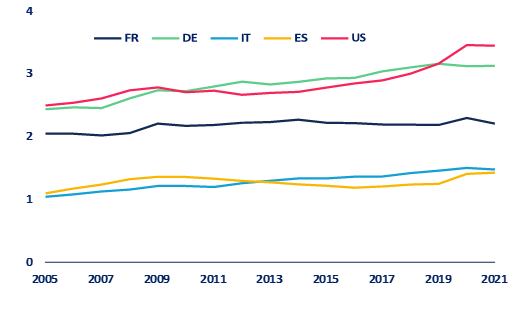
Sources: OECD MSTI, Allianz Research
Cumulative capital raised through IPOs in the technology sector since 1995 (in billion USD) and major technology companies listed on the stock exchange by market size as a share of the total*
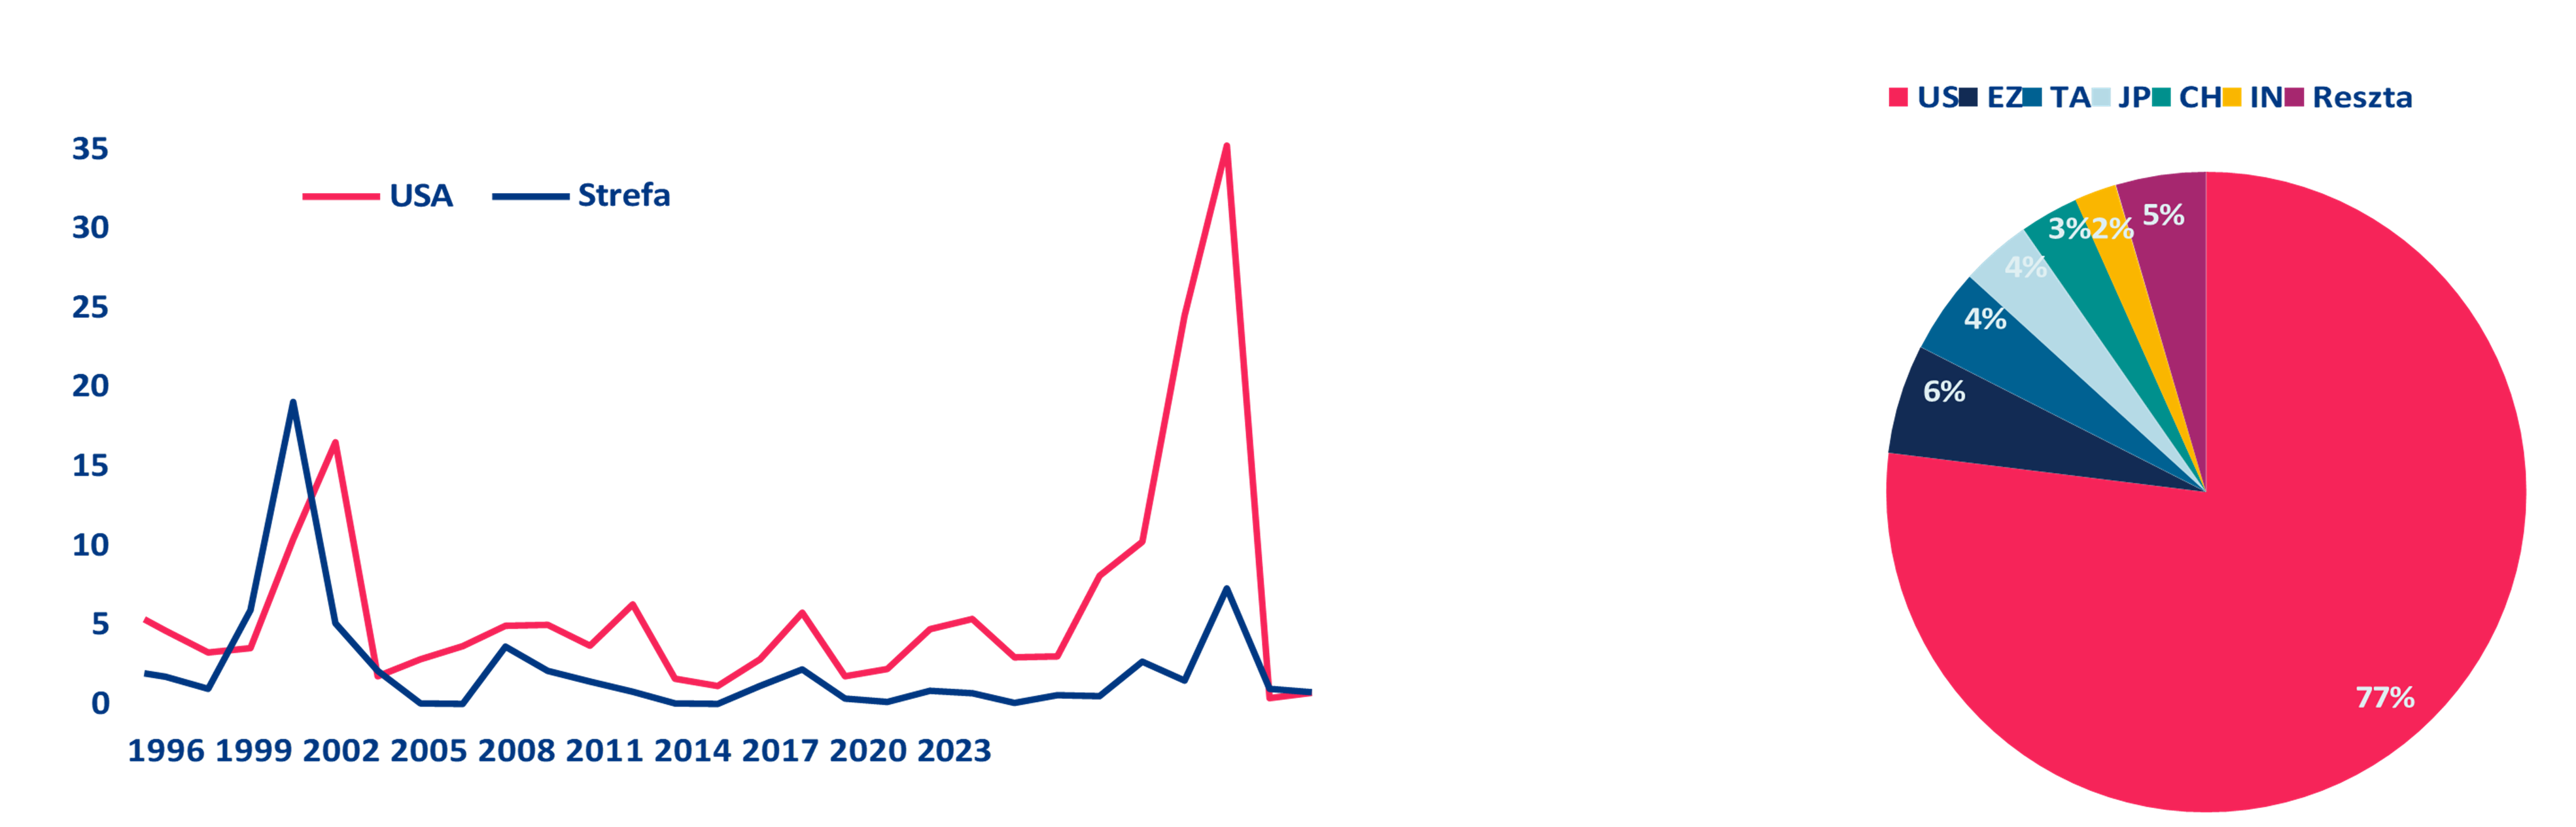
Sources: LSEG Datastream, Allianz Research. * Based on a sample of 562 publicly traded technology companies worldwide
Importantly, the United States has more favorable demographic conditions. Demographics (the growth of the working-age population) explain a significant part of the surplus in American GDP (an average of 0.6 percentage points annually from 2008-2023), although both economic areas face growing demographic challenges. Since the fertility rate in the USA was until recently higher than in most EU-27 countries, the United States has a significantly younger population than the EU. It is expected that in the USA, the demographic dependency ratio, which measures the number of people aged 65 and older per 100 people in the age group from 20 to 64 years, will increase from 31% currently to 42% by 2050, while in the EU 27, it is expected to exceed the 60% threshold by mid-century.
The demographic discrepancy between the USA and the eurozone has been somewhat reduced by good performances of European labor markets, which balanced the differences in outcomes from the slowdown in the growth of the working-age population. The employment rate in the eurozone actually increased by about 7 percentage points from 2008-2023 (including the effect of raising the retirement age, e.g., in Germany to 67 years), while in the United States it slightly decreased.
However, Europe mainly stumbles over its own shoelaces: excessive regulations and bureaucracy hinder productivity growth, while fragmented capital markets make efficient financing difficult
Regulations covering everything from the curvature of cucumbers to the minimum diameter of mussels hinder innovation and make conducting business in the eurozone more difficult than in the USA. In the World Bank’s Doing Business ranking, EU economies surpass the United States in only two indicators – electricity supply and cross-border trade – and that with a small margin. Especially, getting credit in the EU is difficult, making life particularly hard for start-ups, and companies have to navigate through separate regulations and tax rules of each member state.
At the same time, EU programs supporting economic development are too complicated and fragmented, resulting in backlogs (e.g., in the case of absorption of NGEU funds – Next Generation EU) and do not encourage the private sector to increase capital expenditures, unlike in the USA. Finally, politics and national interests have blocked progress in reducing EU countries’ dependence on bank financing and improving capital allocation (creating a Capital Markets Union, CMU), which would increase cross
-border risk sharing and limit credit risk – instead, member states focus solely on promoting current, short-term economic growth.
Disappointing Productivity Growth in the Eurozone
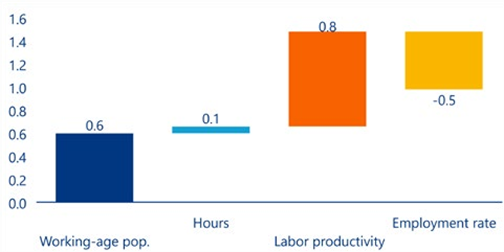
From 2008-2023, for every 1 percentage point of average annual GDP growth, more than 0.8 percentage points were the result of dynamic labor productivity growth on the other side of the Atlantic. From a supply perspective, GDP growth can simply be divided into the growth of the working-age population, the employment rate (i.e., the number of people working as a percentage of the working-age population), the number of hours worked per job, and hourly labor productivity (output per hour worked). It turns out that from 2008-2023, labor productivity in the United States grew on average by 0.8 percentage points annually faster than in the eurozone. Over time, this creates a huge gap that can explain the discrepancy between capital income in the USA and the eurozone, as productivity is the most important factor affecting the standard of living in the long term. The growing productivity gap is all the more striking as European countries are further from the technological frontier, and therefore have fundamentally more potential to catch up in terms of productivity.
Distribution of surplus GDP growth in the USA compared to the eurozone, average annual from 2008-23 (percentage points of GDP growth)
Sources: LSEG Datastream, Allianz Research
In reality, when we decompose the growth of hourly labor productivity into the contribution of capital deepening (the capital-to-labor ratio, i.e., capitalist intensity of production) and total factor productivity (efficiency in which labor and capital inputs are combined to produce a unit of output), it turns out that most of the poor results in the eurozone are due to weak growth in total factor productivity, not weak growth in capital deepening. In other words, it’s not that the eurozone is investing too little in new production capacities, but rather that the basic pace of technological progress and efficiency growth is unsatisfactory.
The existential threat related to the future of the European monetary union and fragmented capital markets, according to Allianz Trade, further limits investments. National interests stand in the way of creating a Capital Markets Union (CMU), hindering efficient capital allocation and contributing to the persistently lower growth in the eurozone compared to the USA. A strong banking union is a prerequisite, but progress is slow due to the lack of a European deposit guarantee system.
Despite initiatives taken since the original project in 2015, legislative proposals are still under negotiation, and their implementation is progressing slowly. If CMU is implemented, it could increase cross-border private risk sharing, reduce dependence on bank financing, and increase capital allocation efficiency, promoting higher economic growth and eurozone integration.
Sources of financing for the corporate sector in the Eurozone
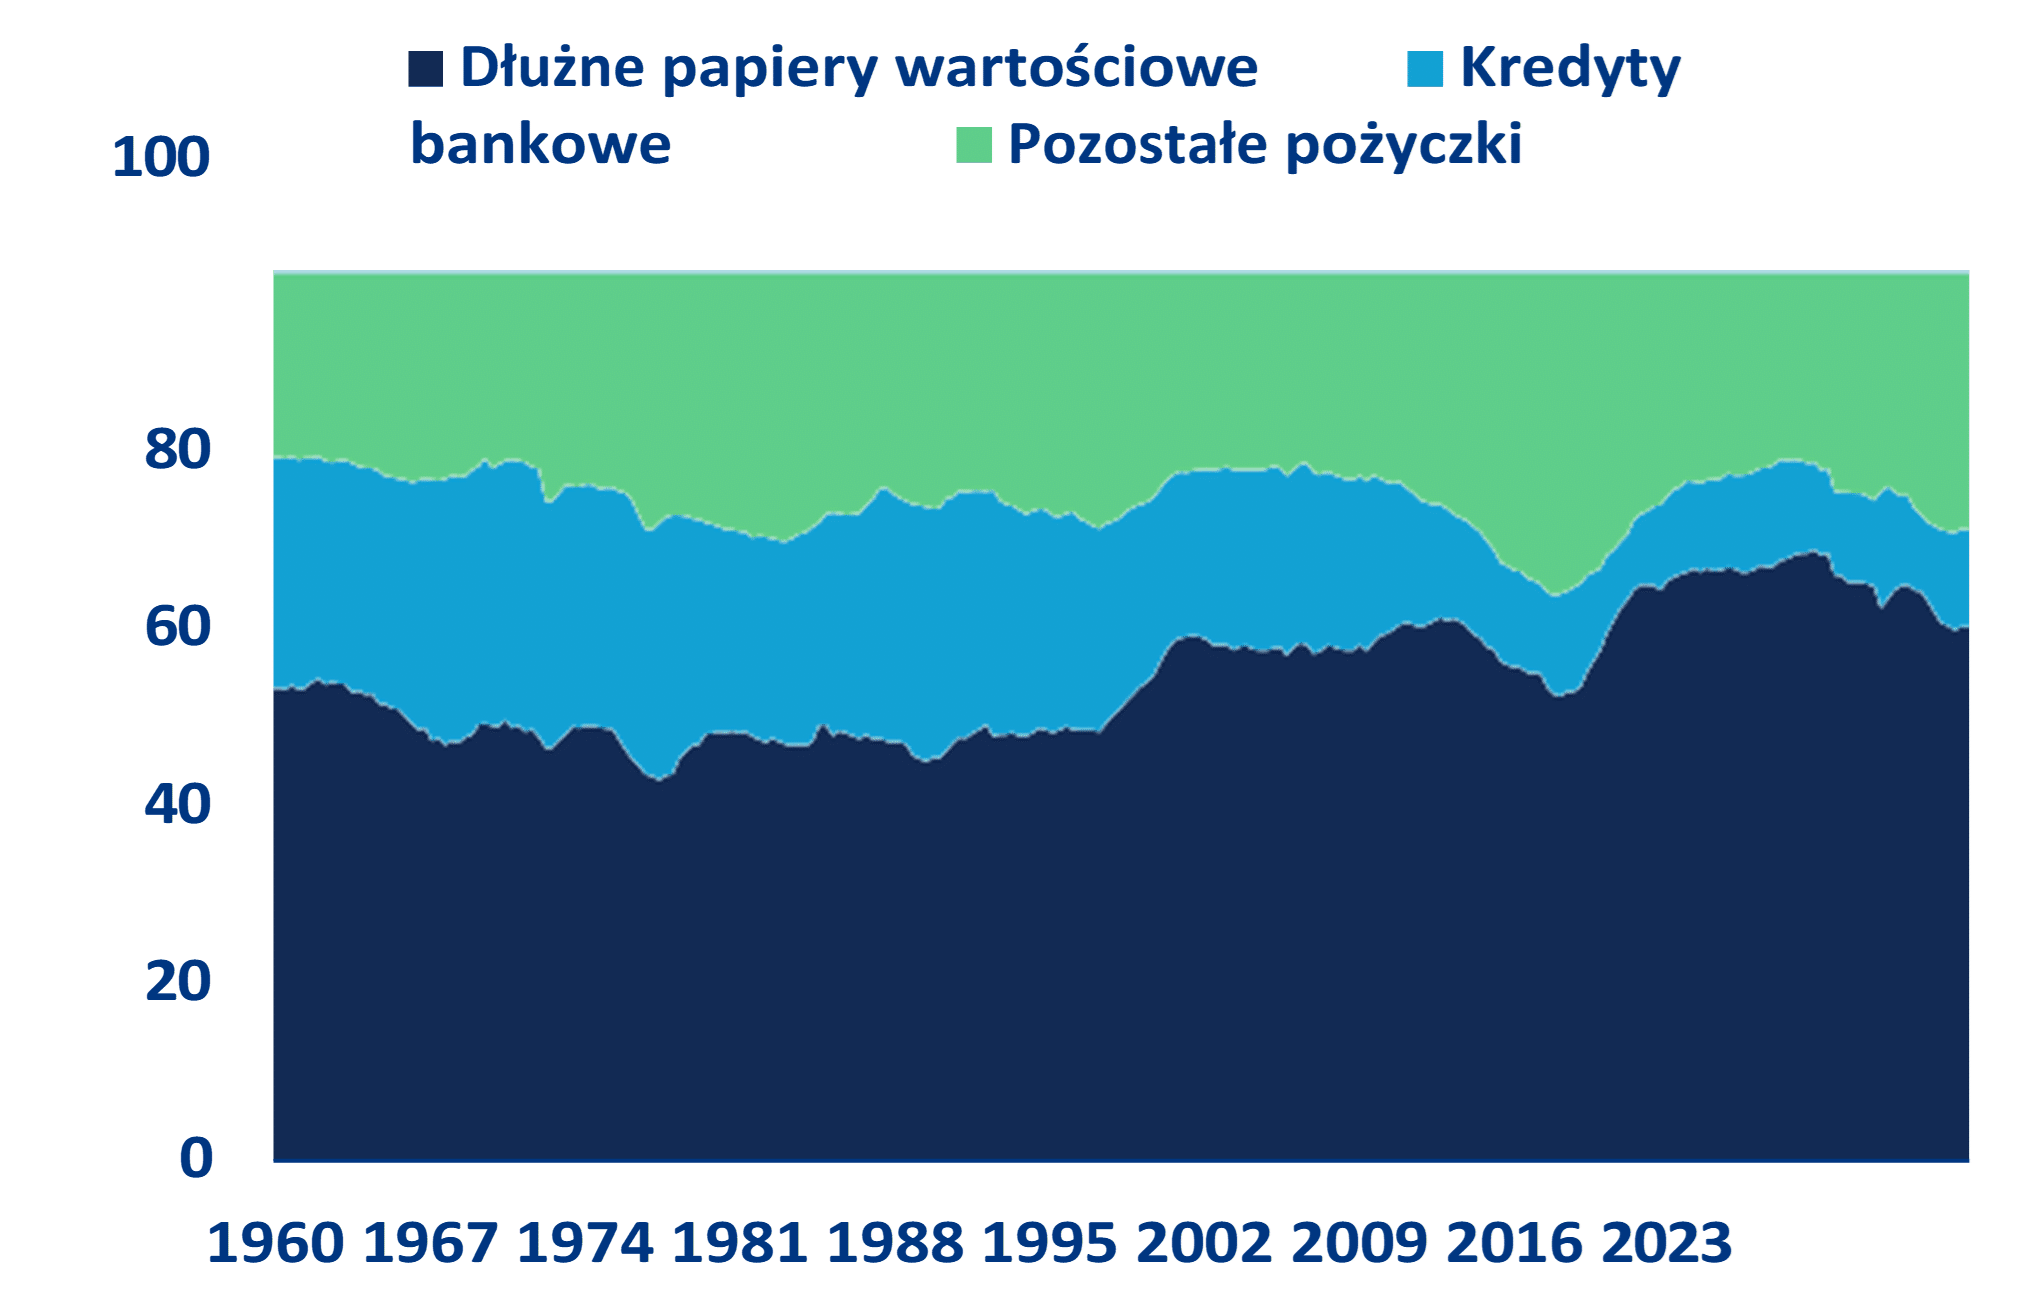
Sources: LSEG Datastream, Allianz Research
While the EU spends large amounts on supporting economic development, its programs are too complicated and fragmented. Industrial policy
has become fashionable again on both sides of the Atlantic. Since 2021, total financial subsidies amounted to 40 billion USD for Germany, 59 billion USD for France, and 230 billion USD for the USA, of which respectively 71%, 59%, and 15% of them were classified as ecological subsidies.
Compared to the level in 2015, subsidies have thus increased about threefold in the United States, doubled in Germany, and eightfold in France. From 2021-2023, subsidy expenditures amounted to 0.3% of GDP in the USA, 0.35% in Germany, and almost 0.75% in France.
Anticipated subsidies for ecology in the EU will likely be even higher than those offered by the American Inflation Reduction Act: 880 billion USD from 2022-2031 for the EU compared to 300-1,000 billion USD in roughly the same time horizon in the USA. While the American industrial policy encourages the private sector to increase investment spending, the same cannot be said about European policy. Investments in factories in the United States have sharply increased since the implementation of the Inflation Reduction Act (IRA) and the CHIPS Act, despite higher costs and interest rates. Meanwhile, in Germany, expenditures on factory construction fell below the level of 2010, while in France they have barely increased in the past few years.
EU programs have been criticized as too complicated and detail-oriented, while the American offer of unlimited tax incentives directed at manufacturers has been praised for its simplicity. Moreover, European governments implement their own tax reliefs at the national level, leading to country-specific differences. This highlights the challenges facing the EU and national governments in establishing a compelling, coherent industrial policy among heterogeneous regulatory and tax frameworks and complex funding access processes. Conversely, the United States leverages its comparative advantage (including lower energy costs, domestic market size, and higher potential growth) to stimulate more investment.
Construction investments in manufacturing plants, Index Q4-2019 = 100
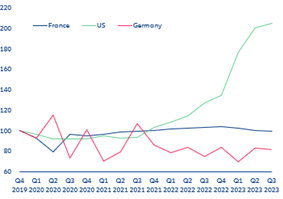
Notes: For the USA: Total private construction spending: Manufacturing in the United States in millions of dollars, monthly, seasonally adjusted (US Census Bureau), price adjusted by the Producer Price Index for intermediate demand “materials and components for construction” (Bureau of Labor Statistics). For Germany: Estimated costs, permits for the construction of factory and workshop buildings (Destatis), price adjusted by the construction price index for commercial buildings, construction work in buildings (Destatis). For France: investment expenditures in construction, volumes.
The outflow of investments from EU countries, in Allianz Trade’s opinion, may be favored not only by the mentioned structural advantages of the USA but also by the strengthened industrial policy of the United States, regardless of who wins the November elections in the USA. Even before the IRA (Inflation Reduction ACT) came into effect in the USA, Germany struggled with limiting investments due to high energy costs and a shortage of skilled labor. The difference between outbound investments (abroad) of German companies and business investments in the country in 2022 was the largest in history: more than 135 billion EUR of direct foreign investments flowed out of Germany, and only 10.5 billion EUR flowed in. Estimates indicate that even 70% of European investments might migrate to the USA as a result of new American incentives, including 80% of projects carried out by German companies. Regardless of who wins the elections in November, American industrial policy is likely to be strengthened, which will be another factor unfavorable to European production. Under a Trump presidency, tax relief for electric vehicles and subsidies for
wind power plants would likely have been repealed, though a House controlled by Democrats could be an obstacle. In a GOP-dominated Congress, wholesale withdrawal of the IRA seems unlikely, as most IRA subsidies bring greater benefits to red (conservative) than blue states. Both a Trump and a Biden presidency would likely increase subsidies for industry, more general under Trump (funded from tariff revenues), and more focused on certain key sectors and technologies under Biden. American industrial policy could also extend its protectionist reach by implementing a carbon border tax and expanding government mandates to favor domestic production.
The Green “Lining” of the European Economy – Its Future Asset?
The EU is taking the lead in the green transformation, and the economies of the eurozone have significantly lower total CO2 emissions and emissions per capita than the USA. The EU has also taken a clear lead in the trade of ecological goods: Germany alone surpasses the USA in ecological exports, and 19 out of 27 EU countries have a comparative advantage in the trade of ecological goods. Conversely, the United States is slowly losing market share, and its advantage in green technologies has deteriorated over time. As the EU seeks to accelerate its green transformation and achieve net-zero emissions by 2050, the green economy will generate more jobs to compensate for potential deindustrialization in declining sectors.
Focusing on the production and export of environmental goods, Europe could further leverage the growing global markets for clean technologies. In 2021, Germany alone generated about 9.1 billion EUR in revenues from energy-efficient drive and control technologies (0.3% of their GDP). This could contribute to economic growth and offset some of the negative effects of deindustrialization. However, the green policy of the EU also includes ambitious standards and regulations that increase production costs, leading to leaks and the relocation of production to countries with less regulated regulations. The EU’s Carbon Border Adjustment Mechanism (CBAM) aims to address this issue by leveling the playing field for EU firms. Yet, the production of green energy in the EU still faces unfavorable competitive conditions.
Ecological subsidies account for more than two-thirds of European subsidies, while in 2022 they accounted for only 20% of total subsidies in the USA. Subsidizing green innovations brings significant benefits both for global growth and for combating climate change. And as investing in the green industry helps build new industrial branches of the future, governments are trying to improve the performance of key business sectors, from energy to semiconductors. In 2021-2023, the lion’s share of green subsidies in the USA was allocated to energy (4.5 billion USD, 37%) and production (6.9 billion USD, 60%), while only 2% or 0.2 billion USD was allocated to transport. However, compared to European countries, ecological subsidies constitute only 15% of total subsidies. The scenario is completely different in Germany, where 71% of subsidies were classified as ecological in the last three years. About 40% or 3.6 billion USD was allocated to production, though the trend is decreasing, while 1.8 billion USD was allocated to energy. Subsidies for ecological transport are negligible and have dropped from nearly 80% of total transport subsidies in 2016 to 0.1% in 2021 to zero in 2023. France moved from 2% of subsidies classified as ecological in 2015 to 60% in 2022. Essentially, they are divided into over 90% on energy (10 billion USD) and the rest on production.
The mentioned economic advantage of the United States over Europe comes with a significant environmental cost. Despite making some progress in the 21st century, the average US citizen still generates nearly three times more annual CO2 emissions than his European counterpart (chart 18). This environmental gap goes far beyond CO2 emissions: According to Global Footprint Network data, if everyone consumed the same amount of natural resources as Americans, it would require 5.1 planets.
What Needs to Be Done to Enhance EU’s Competitiveness?
To restore overall competitive advantage over the USA, the next European Parliament must urgently remove barriers to higher productivity growth. After the June elections to the European Parliament, the main priorities should be: I) reducing bureaucracy and excessive regulation, ii) renewing efforts to deepen the Capital Markets Union
, iii) overcoming issues that prevent quick and timely absorption of EU funds, and iv) striving to strengthen European industrial policy to mitigate the subsidy race between EU countries.
Reducing bureaucracy and excessive regulation, from the labor market to the business environment. Simplifying regulations and taxes across Europe would also help strengthen the internal market. The current proposal to simplify
tax regulations in the EU aims to reduce bureaucracy for cross-border businesses – but it remains to be seen whether they will be adopted. Currently, there are 27 different tax systems in the EU. Complying with tax regulations is costly, not used in production activity, and may discourage expansion. Thanks to new, simpler regulations, the cost of complying with tax regulations for businesses operating in the EU internal market could fall by as much as 65%.
Capital Markets Union (CMU): overcoming national and political interests. The CMU initiative, launched in 2015, aims to develop and integrate EU capital markets to diversify corporate financing, increase investment opportunities, and strengthen the EU economy’s resilience. However, EU capital markets still lag behind the United States and the United Kingdom and face challenges such as limited equity participation, fragmented market activity, and persisting heterogeneity among member states. Two CMU action plans, adopted in 2015 and 2017, struggled to achieve political consensus on long-term goals. Persistent fragmentation creates barriers to cross-border transactions and liquidity. Achieving CMU will require political will to overcome resistance from particular interests. One source of resistance will be entrenched operators fearing profitability loss, including local banking lobbies; local banks must be convinced that part of the solution to structurally weak profitability is cautious entry into capital markets. The ECB report led by Christine Lagarde advocates a top-down approach to implementing CMU. This includes establishing the European Securities and Markets Authority (ESMA) with enhanced powers for uniform supervision and a single set of rules to reduce fragmentation in EU capital markets, as well as the need for consolidated market infrastructure.
A truly integrated European financial union requires a well-functioning banking union and a vibrant capital markets union in a healthy competitive environment. CMU must complement banking, not replace it, so that the whole is greater than the sum of its parts. Reaping economic benefits from both market-based and relationship-based financing requires appropriate public oversight. Regulatory approaches in capital markets must focus on facilitating the introduction of effective market discipline, with prudential supervision over systemic entities.
Finally, progress in financial integration must be accompanied by fiscal responsibility and structural reforms. Efforts to complete the banking union and capital markets union must be part of a broader drive to level productivity differences and accelerate income per capita convergence across Europe, with countries striving for fiscal adjustment and reforming production and labor markets to improve their attractiveness as investment destinations. The Capital Markets Union promises easier capital flows – but it is a risk-return compromise that will determine their direction.
Completing the banking union, closely linked to the capital markets union, is a key step towards a stronger and more integrated European financial sector. Agreement on the missing third pillar in the form of a European deposit guarantee system would significantly increase market confidence and integration. Strengthened supervision and harmonized restructuring and orderly bank liquidation have already strengthened the sector, which has seen an improvement in capital adequacy and balance sheet quality since 2014, alongside the establishment of a credible safety net for the system.
Complementarity and economic cohesion among member states are essential for the eurozone. This is because economic imbalances increase the risk of instability in the monetary union. Unilateral or uncoordinated national industrial policy, leading to further divergences in the Union, thus poses a significant risk to the monetary union. Therefore, it would be better to have a truly European industrial policy. This means the same framework conditions and financing conditions for industry in all member states. It would reduce harmful competition for subsidies between countries and focus on competition between locations. Misallocations would be limited, and the continent’s potential maximized.
Poland – Soon Opening of Funds from the RRP, i.e., NGEU. Their Timely and Efficient Spending is a Postulate for the Entire EU
To maximize the benefits from the Next Generation EU initiative (including our RRP), member states should accelerate progress in achieving the goals and milestones set out in their national reform programs, as well as make the best use of infrastructure and resources for fund allocation.
What’s Wrong with NGEU Funds? (Next Generation EU – European Recovery Plan)
As initially feared, NGEU expenditures encountered delays across the EU, significantly reducing their potential positive impact on the economy. A large portion of NGEU expenditures was initially planned for 2021-2023 to accelerate immediate recovery from the pandemic. Since payouts depend on qualitative milestones and quantitative targets (i.e., structural reforms), delays in implementation soon appeared. As of today, member states have received about 26% of the resources from the Recovery and Resilience Facility (out of 672 billion EUR in grants and loans). By December 2023, most countries had received only the first payment (11 member states), few of them received the second and third payments, while only Italy and Portugal received four installments (though they gathered about 50% and 35% of the total allocated funds, respectively). About one-third of member states are experiencing delays in planned reforms and investments, partly due to economic constraints and labor shortages, but also due to a lack of administrative and monitoring capabilities to manage an unprecedented amount of resources in a short time. This explains why actual payments were made later, and sometimes were also smaller than initially applied for. As a result, the initial payment schedule has been shifted more towards 2025-2027, and the economic impact will likely be lower than initially estimated and more spread out over time.
Expenditures from European structural investment funds vs. the status of NGEU fund spending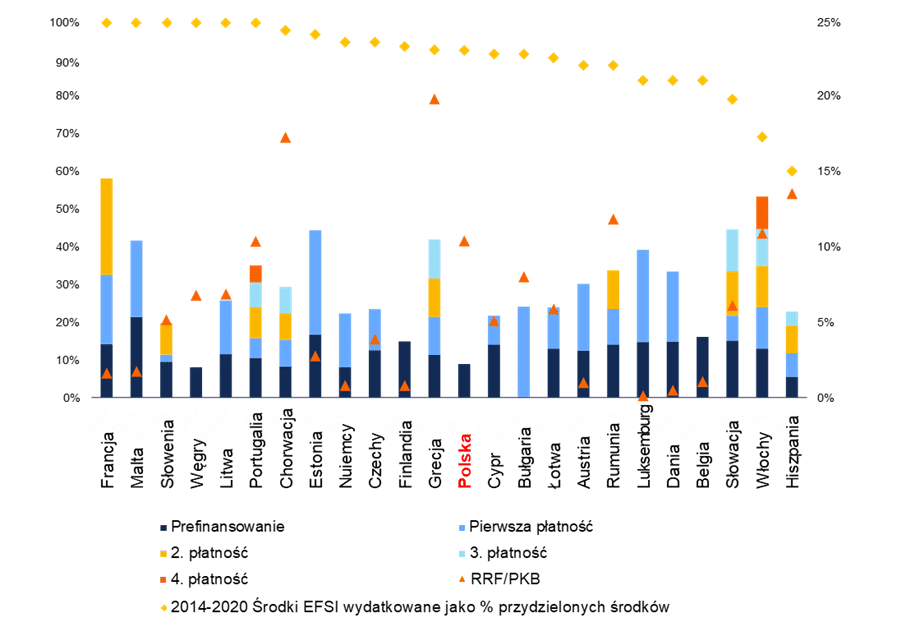
Sources: EC, Allianz Research
This is not the first time European funds have taken time to reach the economies that need them most. The European Structural Investment Funds (ESIF) also experienced delays in spending. In particular, under the EU budget for 2014-2020, Italy and Spain managed to spend just 10% of the funds within the first four years, trying to catch up towards the end of the budget period. This reflected a lack of planning infrastructure and likely difficulties in finding valuable projects to finance. The complexity of tender procedures and coordination, insufficient technical knowledge of the public administration, and inadequate monitoring remain key issues to be addressed.
While structural issues are not insignificant, global challenges have created additional risks. High inflation led to upward revisions of planned project costs and focused attention on the bloc’s energy dependence. Consequently, amendments were made to the original plans to include RePowerEU chapters, designed to address the energy shock in 2022, in particular to facilitate additional reforms and investments to gradually phase out Russian energy imports. This instrument is based on up to 225 billion EUR of unused loans from the RRF. Among other priorities, RePowerEU aims to address delays in the implementation of wind and solar energy in some regions.