American companies represented in the S&P 500 index have reported better-than-expected results; meanwhile, there is also improvement in the European Stoxx 600 index, but it is uneven (Polish companies performed the worst).
- Companies in the American S&P 500 index continued to surpass expectations, leading to the highest year-over-year earnings growth since Q2 2022. Despite mixed forecasts for the next quarter, analysts still predict an 11% earnings growth in 2024.
- In Europe, the results are less optimistic but show signs of improvement, with positive momentum suggesting that a 5% earnings growth in 2024 will be possible.
- The financial sector is the only sector in Europe that continues to report positive annual earnings and revenue growth.
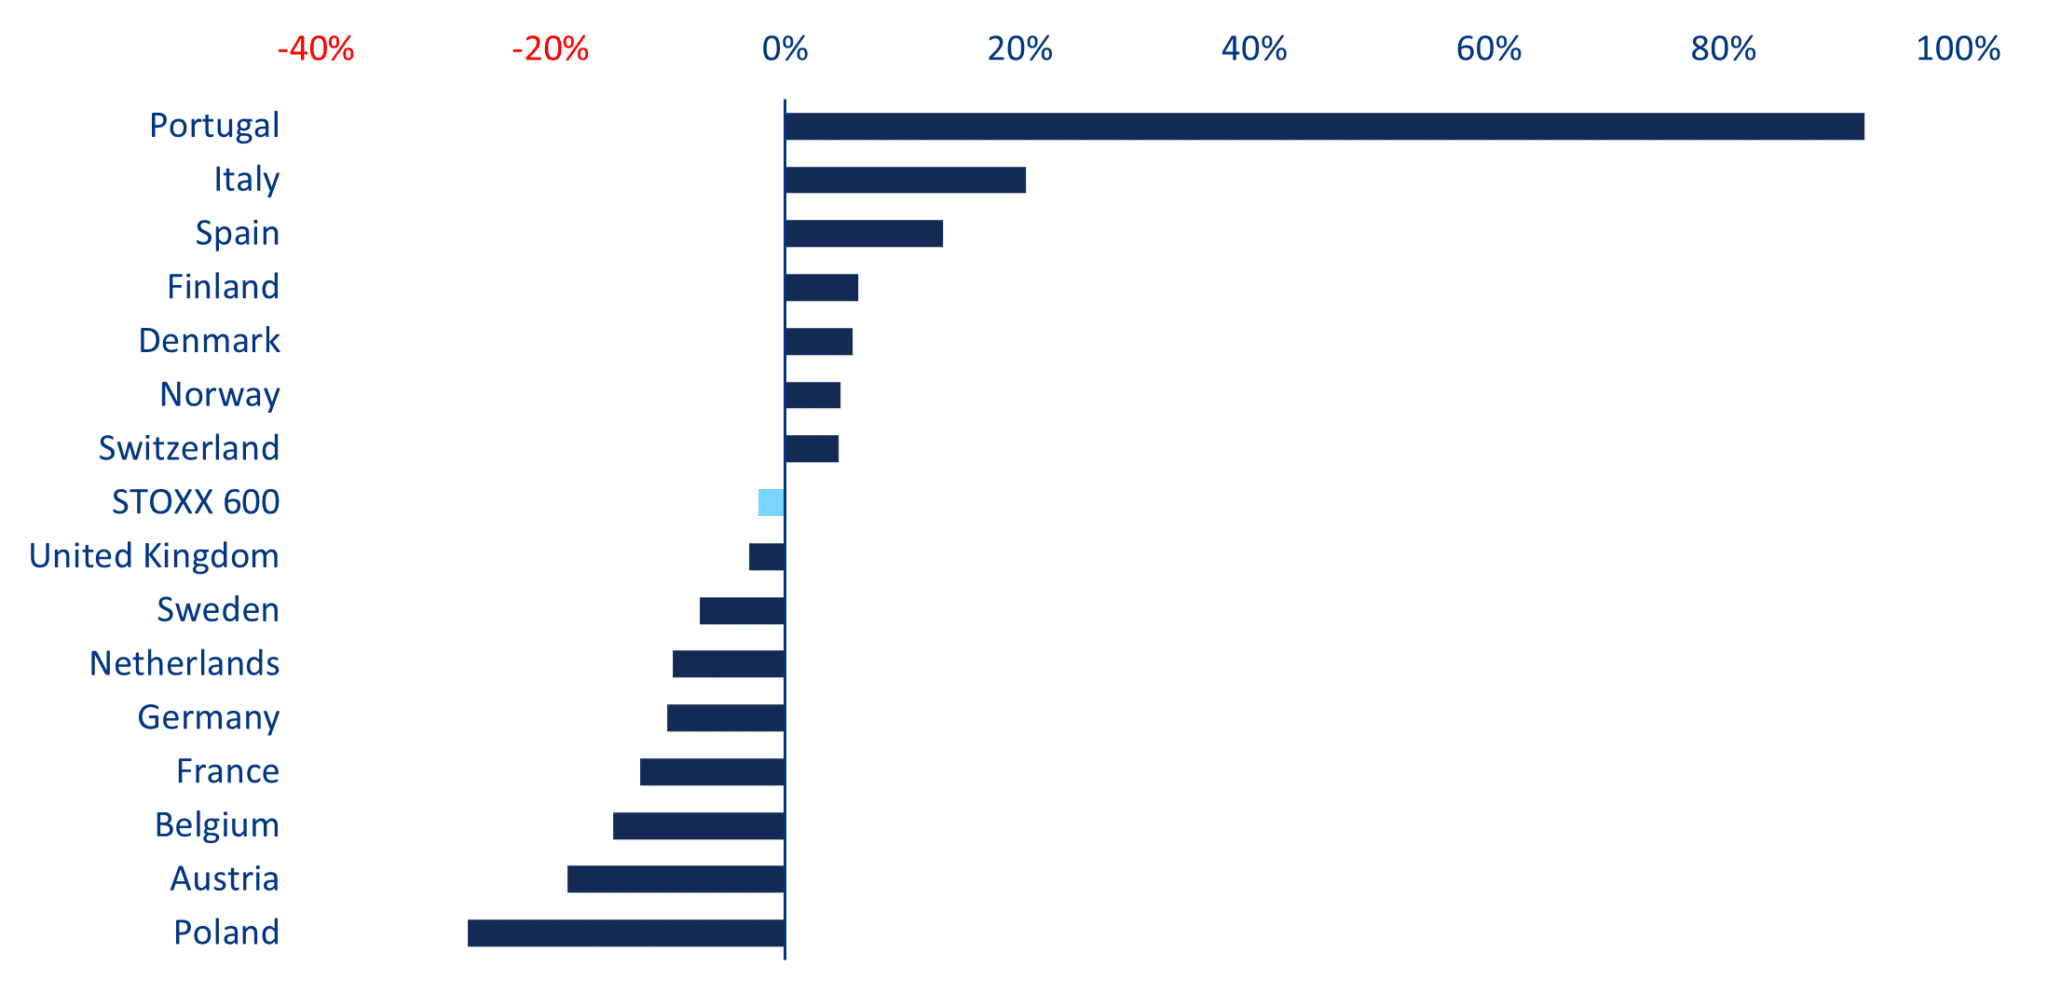
- The results of European companies in the Stoxx 600 are highly varied across countries: analysts expect positive earnings growth in Q1 for companies from seven out of 15 countries represented in the STOXX 600 index. It is predicted that companies from Portugal (+92.0%) and Spain (+20.5%) will record the highest annual earnings growth rates, while those from Poland (-27.1%) and Austria (-18.6%) will record the lowest growth.
- Despite these generally encouraging signals from both indexes, the current market reactivity and profit concentration indicate elevated risks centered around a few companies and their high valuations (in short: a small subset of megacorporations drives the entire market’s performance), which could lead to asymmetric negative reactions to bad news.
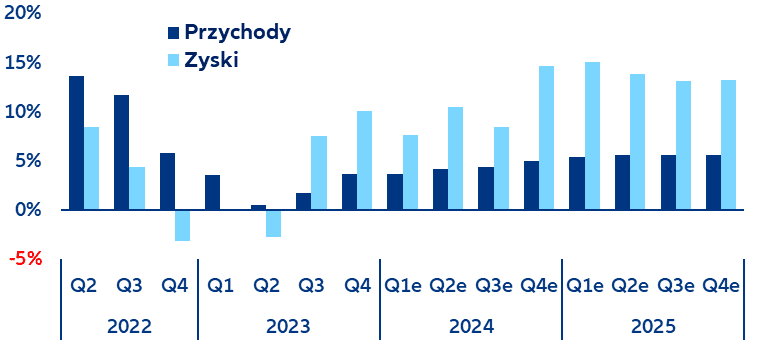
In the first quarter of 2024, companies in the S&P 500 index recorded the highest year-over-year earnings growth (+7.6%) since the second quarter of 2022 and the highest revenue growth (+3.7%) since the fourth quarter of 2022, bringing a new dose of corporate optimism to the markets. As the Q1 earnings season comes to a close, about 77% of S&P 500 companies exceeded analysts’ earnings expectations, and 60% exceeded revenue estimates. Profit margins also showed positive trends, reaching a level 11.7% higher than the previous quarter and slightly above the five-year average. This consistent profitability growth continues to underscore the strength of American companies’ operational efficiency and their ability to navigate the current macroeconomic and geopolitical environment. Nevertheless, companies themselves seem less optimistic about the ongoing quarter, with over half issuing negative EPS forecasts. According to Allianz Trade, analysts remain optimistic for the full year, forecasting an earnings growth rate of ~11% (see Chart 1).
Chart 1: Revenue and earnings growth of S&P 500 companies (YoY%)
Sources: LSEG I/B/E/S, Allianz Research
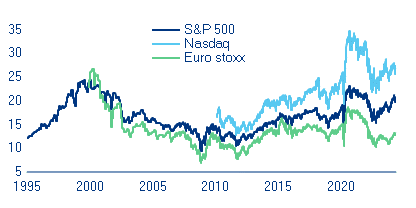
Market reactions to surprising financial results were greater than average. Companies reporting positive earnings surprises saw an average price increase of +1%, while those reporting negative surprises saw an average price drop of -3%. This difference highlights the market’s sensitivity to financial results relative to expectations, exacerbated by the tight valuations prevailing in American markets, leading to an asymmetric response function to positive and negative news. To put this in context, the forward 12-month P/E ratio for the S&P 500 is currently 20.8, a level comparable to the stock rallies of 2000 and 2020 (see Chart 2).
Chart 2: FWD PE 12-month comparison
Sources: LSEG I/B/E/S, Allianz Research
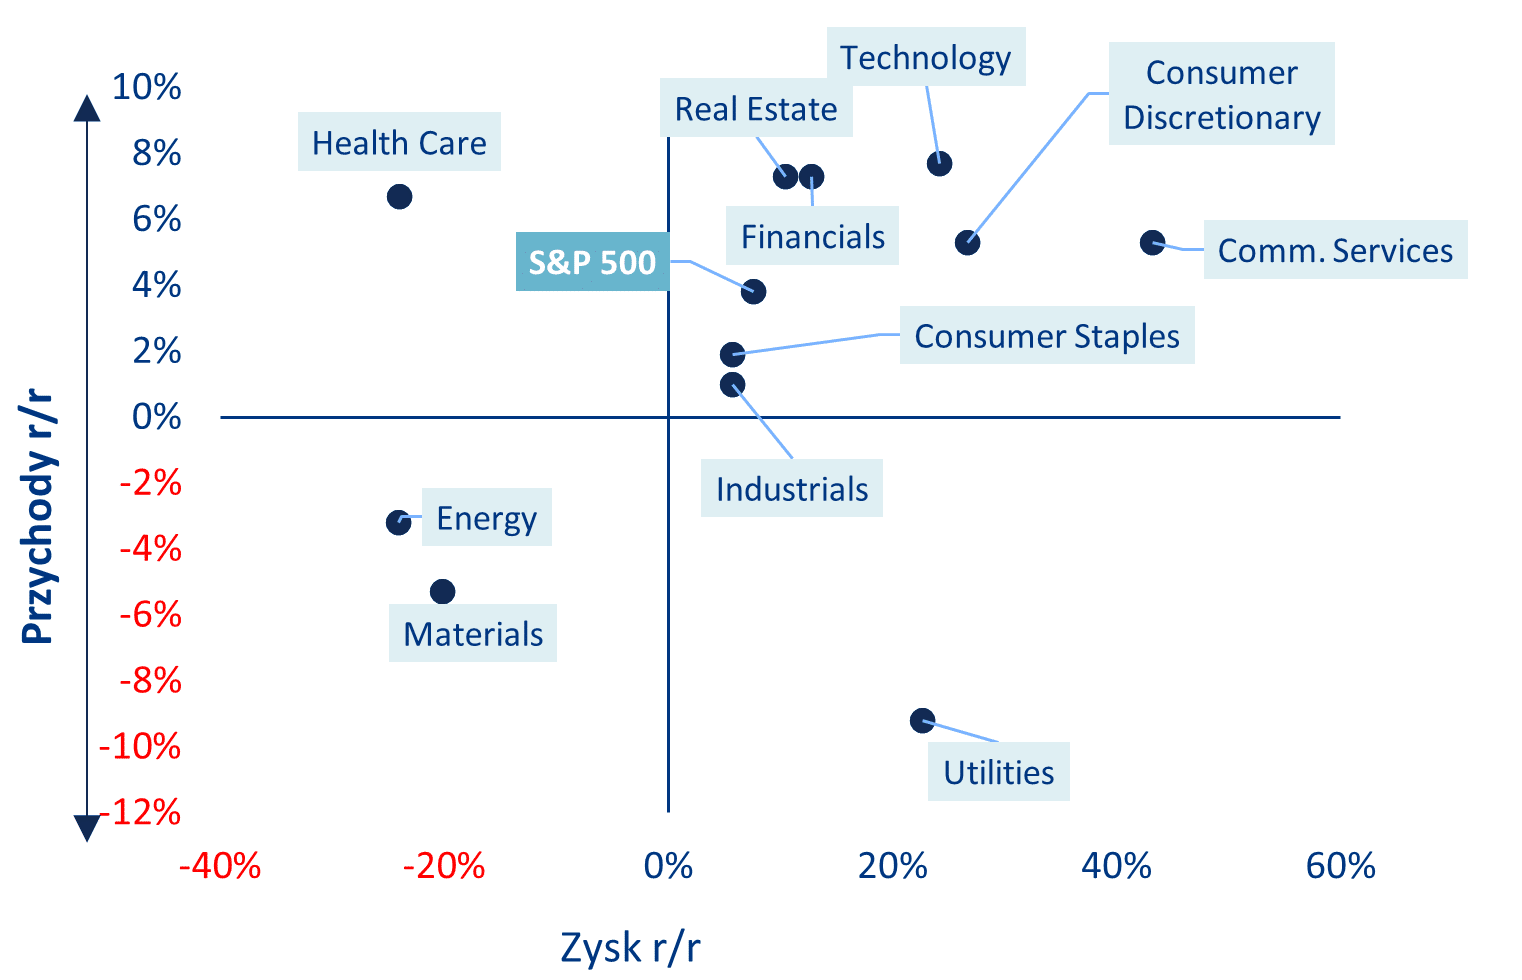
Communication Services topped the table with the highest year-over-year earnings growth of +34%, driven mainly by Alphabet and Meta. Excluding these two key companies, Allianz Trade’s calculations show that sector growth would significantly drop to +2%. The Utilities sector recorded the second-highest earnings growth rate (+33%), despite continued revenue pressure. The Consumer Goods sector came next (+24.5%), primarily due to Amazon. Without Amazon, the growth rate would drop to +2.4% annually. The Technology sector reported a 23.6% increase, largely due to NVIDIA. On the negative side of the earnings season, the Healthcare and Energy sectors saw significant declines of -25.4%, followed by Basic Materials at -20.6% (see Chart 3).
Chart 3: S&P 500 – Estimated earnings growth rate in Q1 2024 by sector
Sources: LSEG IBES, Allianz Research
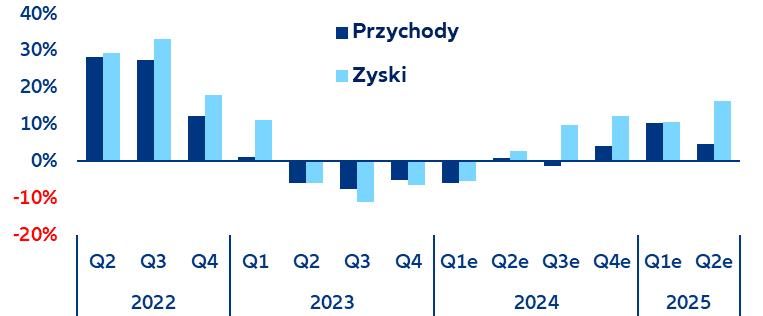
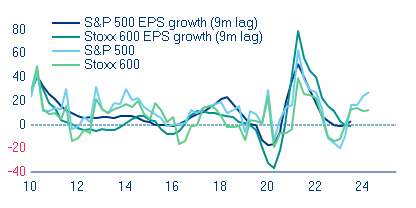
Across the Atlantic, optimism is moderate but shows signs of fundamental improvement. So far, about 90% of companies have reported, with about 60% exceeding analysts’ earnings expectations and 50% exceeding revenue estimates. Although overall results remain negative, they indicate that the Stoxx 600 index is gaining momentum after three quarters of significant negative year-over-year earnings and revenue growth. In Q1, companies are expected to record -2% earnings growth year-over-year and -4% revenue growth, the highest results since Q1 2023, approaching the positive threshold for earnings and revenues. Additionally, positive quarterly earnings and revenue growth suggest that the forecasted 5% earnings growth in 2024 may be achievable, provided no exogenous factors disrupt the current trend. Ultimately, this anticipated balance sheet improvement and resilience justify the relatively small performance gap between US and European stocks (see Charts 4 and 5).
Chart 4: Earnings and revenue growth in the Stoxx 600 index (YoY%)
Sources: LSEG I/B/E/S, Allianz Research
Chart 5: Comparison of price and EPS growth
Sources: LSEG I/B/E/S, Allianz Research
Despite these weak but encouraging results, the earnings season in Europe has been uneven across countries. Analysts expect positive earnings growth in the first quarter in seven out of 15 countries represented in the STOXX 600 index. It is predicted that companies from Portugal (+92.0%) and Spain (+20.5%) will record the highest annual earnings growth rates, while those from Poland (-27.1%) and Austria (-18.6%) will record the lowest growth. Looking ahead, we predict that the economic recovery in Europe over the next two years will support major economies like Germany and France in achieving positive earnings and revenue growth momentum. This, in turn, should help improve the overall fundamentals of equity indexes, bringing them to more stable and comfortable levels (see Chart 6).
Chart 6: Stoxx 600 – Estimated earnings growth rate in Q1 2024 by country
Sources: LSEG IBES, Allianz Research
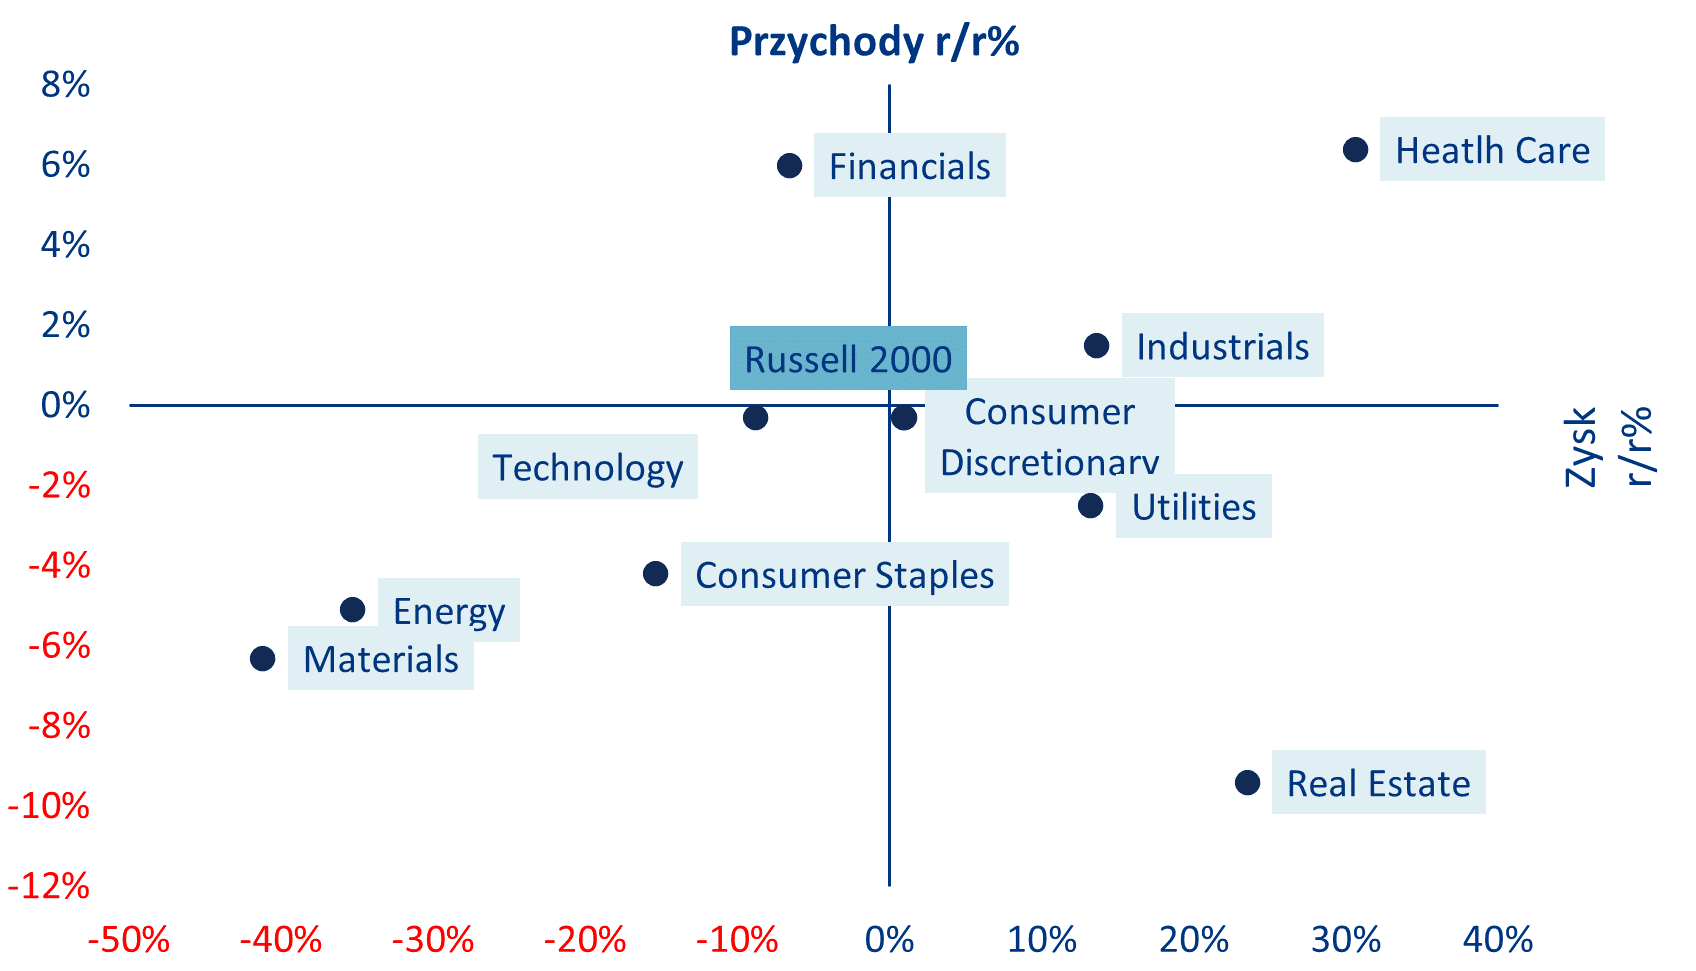
The financial sector is the only sector in Europe that continues to report positive annual earnings and revenue growth. All other sectors showed negative top or bottom lines. Overall, three out of ten sectors in the index are expected to report better earnings compared to Q1 2023. The leading utilities sector boasts the highest earnings growth rate (+18.2%), while the real estate sector is expected to have the weakest growth (-31.9%, see Chart X7). Despite most sectors reporting negative earnings, large
European companies (i.e., GRANOLAS) continue to perform well, driving broad European index growth, similar to the US (see Chart 7).
Chart 7: Stoxx 600 – Estimated earnings growth rate in Q1 2024 by sector
Sources: LSEG IBES, Allianz Research
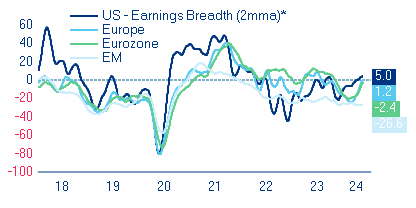
Earnings revision ratios are rising, and analysts are increasingly confident in the continued earnings and revenue momentum observed in Q1. This positive outlook aligns with our earnings growth estimates based on macroeconomic data and supports expected equity performance in 2024 at around +10% for both European and American markets. However, the earnings season has highlighted growing concentration risks in stock markets, both in price and fundamental terms, with a small subset of megacorporations driving overall market performance. This emphasizes the asymmetric reaction of market participants to negative news, with adverse events being sold off three times more intensely than positive ones, reflecting tight valuations and likely overly optimistic expectations for stock market performance (see Chart 14).
Chart 14: Earnings dispersion (2-month moving average)
Sources: LSEG IBES, Allianz Research
Note: The earnings dispersion represents the percentage of analyst expectations revised upward or downward.

